Being curious about the possible savings, I wrote a
spreadsheet to compute and graph the savings in terms of both money and fuel. Using the price per gallon of fuel and the annual mileage travelled as starting inputs, the spreadsheet calculates the amount of fuel purchased per year and its cost, for vehicles getting from 10 to 320 mpg (US gallons), in 10 mpg increments. In addition, it calculates the savings of vehicles getting 20 to 320 mpg, compared to driving a vehicle that gets 10 mpg less.
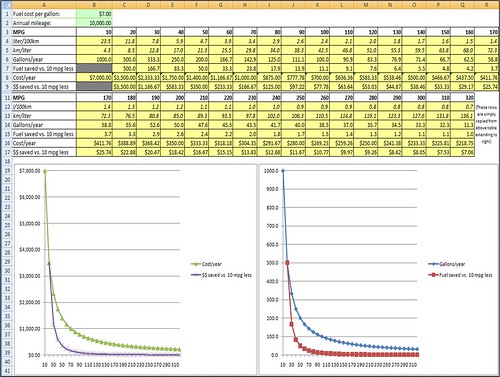
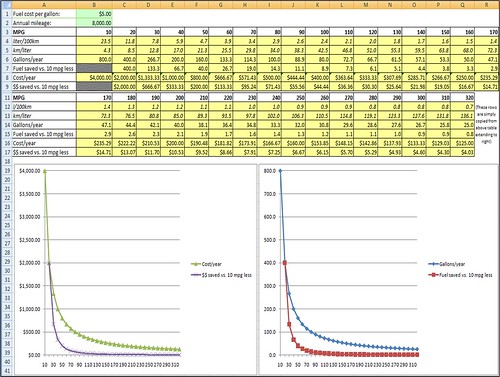
The first image below shows the data and graphs using $3.50/gallon gas and 10,000 miles per year; roughly the current price of gasoline and my approximate annual mileage (I drive about 6k miles per year in my car and about 4k on my motorcycle, which makes for a convenient total). The second image shows the data and graphs for $7/gallon gas and 10,000 miles per year, and the third image shows the data and graphs for $5/gallon gas and 8,000 miles per year (all charts are clickable to view larger versions; those on Flickr can be magnified further by clicking the magnifying glass icon). The inputs for those last two versions were somewhat randomly chosen to see the impact of different levels of higher fuel prices, without and with a reduction in distance travelled. If you want to look up your own mileage and costs, there's a more convenient way coming up.
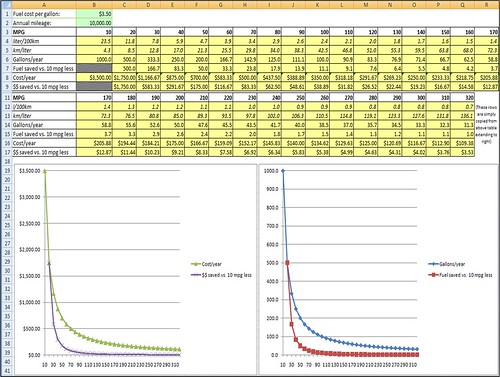
What I found most striking about these graphs is that all curves are shaped identically, regardless of fuel cost or annual mileage. Two major observations struck me next:
- The savings taper off rapidly.
- The greatest savings occur when improving the worst mileage.
The two charts below come from an Energy Information Administration web page and show fuel consumption for cars, light trucks (i.e.: vans, pickups, SUVs), and heavy trucks in terms of both thousands of gallons per year per vehicle, and millions of barrels per day nationally (the latter also includes planes, trains, and ships).

Clearly, big rigs aren't nearly the problem that personal vehicles are (though at 7 mpg they certainly have room for improvement). With so much of national daily consumption being due to personal vehicles, it would certainly help for anyone getting less than 20 mpg to upgrade to 30 mpg or better when it's time to replace their old car. With light trucks also making up a substantial portion of the total, more efficient options need to be available for consumers who can't switch to a wagon or minivan because they truly need the capabilities of a pickup, van, or SUV. If the U.S. is to reduce its dependence on oil (we currently consume about 23% of the world's supply, with much of it coming from hostile nations), these areas are where the greatest return on investment is to be found.
For those who want to see what kind of savings are already possible today, here's a more real-world version of the spreadsheet for vehicles getting between 5 and 40 mpg, in 1 mpg increments. If you travel more, or less, than 10,000 miles per year, simply multiply the "Gallons/year" and "Cost/year" figures by whatever multiple of 10k miles you actually drive (e.g. 1.5 if you drive 15k miles/yr, or 0.6 if you drive 6k miles/yr). Incidentally, the reason why these curves look slightly different than the previous ones is because the scale on these only goes to 40 mpg and not 320; they essentially provide an expanded view of the first eighth of the first chart above.
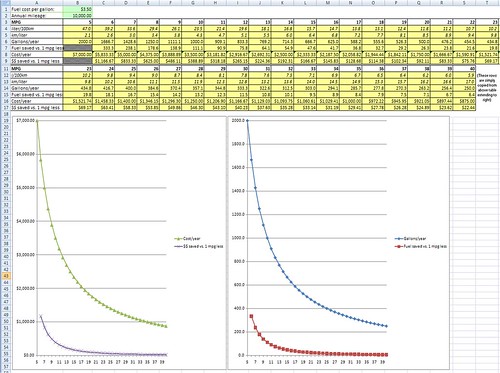
Note that going from 15 to 20 mpg saves $583 per year (666.7 gal/yr - 500 gal/yr = 166.7 gal/yr @ $3.50 = $583.45), while going from 25 to 30 mpg saves only $233 (400 gal/yr - 333.3 gal/yr = 66.7 gal/yr @ $3.50 = $233.45). In other words, going from 15 to 20 mpg saves 100 more gallons per year ($350 at current prices) than going from 25 to 30 mpg.
For those already getting 35 mpg, going to 40 mpg saves only $125 (285.7 gal/yr - 250 gal/yr = 35.7 gal/yr @ $3.50 = $124.95) - about $10 a month, which is likely not enough to justify a different car payment. At the opposite extreme, though, going from 10 to 15 mpg will save $1167 (1000 gal/yr - 666.7 gal/yr = 333.3 gal/yr @ $3.50 = $1166.55), or $97 a month, which potentially could justify switching from an extreme gas hog to a less extreme gas hog, depending on one's financial situation. Going from a 10 mpg pickup truck to a 20 mpg one will save $1750 (1000 gal/yr - 500 gal/yr = 500 gal/yr @ $3.50 = $1750), or $146 a month, which could be even more compelling. As an aside, hypermiling techniques are another option for improving fuel economy of even non-hybrids without the expense of a new vehicle or modifications.
While the savings will be correspondingly higher as fuel prices increase, and also for those who drive more than 10,000 miles a year, one can see from this and the three earlier charts that the savings will nonetheless diminish drastically as mpg goes higher; hence the title of this blog post. The most substantial savings in both fuel volume and money are at the low end of the scale. Of course, as long as it isn't raining and I don't need to carry a lot of stuff around, I'm still going to ride my 50 mpg motorcycle - if I need to go further than I can via bicycle! :)
No comments:
Post a Comment